Google Cloud Trace observability for ADK
With ADK, you can already inspect and observe your agent interaction locally utilizing the powerful web development UI discussed in here. However, for cloud deployment, you will need a centralized dashboard to observe real traffic.
Cloud Trace is a component of Google Cloud Observability. It is a powerful tool for monitoring, debugging, and improving the performance of your applications by focusing specifically on tracing capabilities. For Agent Development Kit (ADK) applications, Cloud Trace enables comprehensive tracing, helping you understand how requests flow through your agent's interactions and identify performance bottlenecks or errors within your AI agents.
Overview
Cloud Trace is built on OpenTelemetry, an open-source standard that supports many languages and ingestion methods for generating trace data. This aligns with observability practices for ADK applications, which also leverage OpenTelemetry-compatible instrumentation, allowing you to:
- Trace agent interactions: Cloud Trace continuously gathers and analyzes trace data from your project, enabling you to rapidly diagnose latency issues and errors within your ADK applications.
- Debug issues: Quickly diagnose latency issues and errors by analyzing detailed traces. This is crucial for understanding issues that manifest as increased communication latency across different services or during specific agent actions like tool calls.
- In-depth Analysis and Visualization: Trace Explorer is the primary tool for analyzing traces, offering visual aids like heatmaps for span duration and waterfall views to easily identify bottlenecks and sources of errors within your agent's execution path.
The following example will assume the following agent directory structure:
working_dir/
├── weather_agent/
│   ├── agent.py
│   └── __init__.py
└── deploy_agent_engine.py
└── deploy_fast_api_app.py
└── agent_runner.py
# weather_agent/agent.py

import os
from google.adk.agents import Agent

os.environ.setdefault("GOOGLE_CLOUD_PROJECT", "{your-project-id}")
os.environ.setdefault("GOOGLE_CLOUD_LOCATION", "global")
os.environ.setdefault("GOOGLE_GENAI_USE_VERTEXAI", "True")


# Define a tool function
def get_weather(city: str) -> dict:
    """Retrieves the current weather report for a specified city.

    Args:
        city (str): The name of the city for which to retrieve the weather report.

    Returns:
        dict: status and result or error msg.
    """
    if city.lower() == "new york":
        return {
            "status": "success",
            "report": (
                "The weather in New York is sunny with a temperature of 25 degrees"
                " Celsius (77 degrees Fahrenheit)."
            ),
        }
    else:
        return {
            "status": "error",
            "error_message": f"Weather information for '{city}' is not available.",
        }


# Create an agent with tools
root_agent = Agent(
    name="weather_agent",
    model="gemini-2.5-flash",
    description="Agent to answer questions using weather tools.",
    instruction="You must use the available tools to find an answer.",
    tools=[get_weather],
)
Cloud Trace Setup
Using the ADK CLI
You can enable cloud tracing by adding a flag when deploying or running your agent using the ADK CLI.
Programmatic Setup
Using ADK App abstractions
Using Telemetry modules
For fully customized agent runtimes, you can enable cloud tracing by using the built-in telemetry modules.
import (
    "context"
    "log"
    "time"

    "google.golang.org/adk/telemetry"
)

func main() {
    ctx := context.Background()

    // Initialize telemetry with cloud export enabled.
    // By default, the GCP project ID is read from the GOOGLE_CLOUD_PROJECT environment variable.
    // You can also specify it explicitly using telemetry.WithGcpResourceProject("my-project").
    telemetryProviders, err := telemetry.New(ctx,
        telemetry.WithOtelToCloud(true),
        // telemetry.WithGcpResourceProject("your-project-id"),
    )
    if err != nil {
        log.Fatalf("failed to initialize telemetry: %v", err)
    }
    defer func() {
        shutdownCtx, cancel := context.WithTimeout(context.Background(), 5*time.Second)
        defer cancel()
        if err := telemetryProviders.Shutdown(shutdownCtx); err != nil {
            log.Printf("failed to shutdown telemetry: %v", err)
        }
    }()

    // Register as global OTel providers
    telemetryProviders.SetGlobalOtelProviders()

    // ... your agent code ...
}
Inspect Cloud Traces
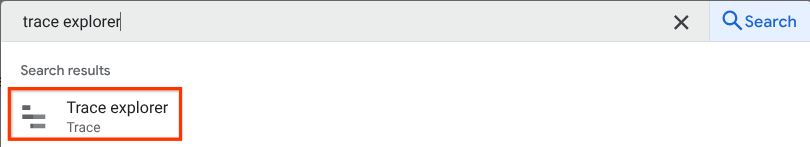
After the setup is complete, whenever you interact with the agent, it will automatically send trace data to Cloud Trace. You can inspect the traces by visiting the Trace Explorer in the Google Cloud Console.
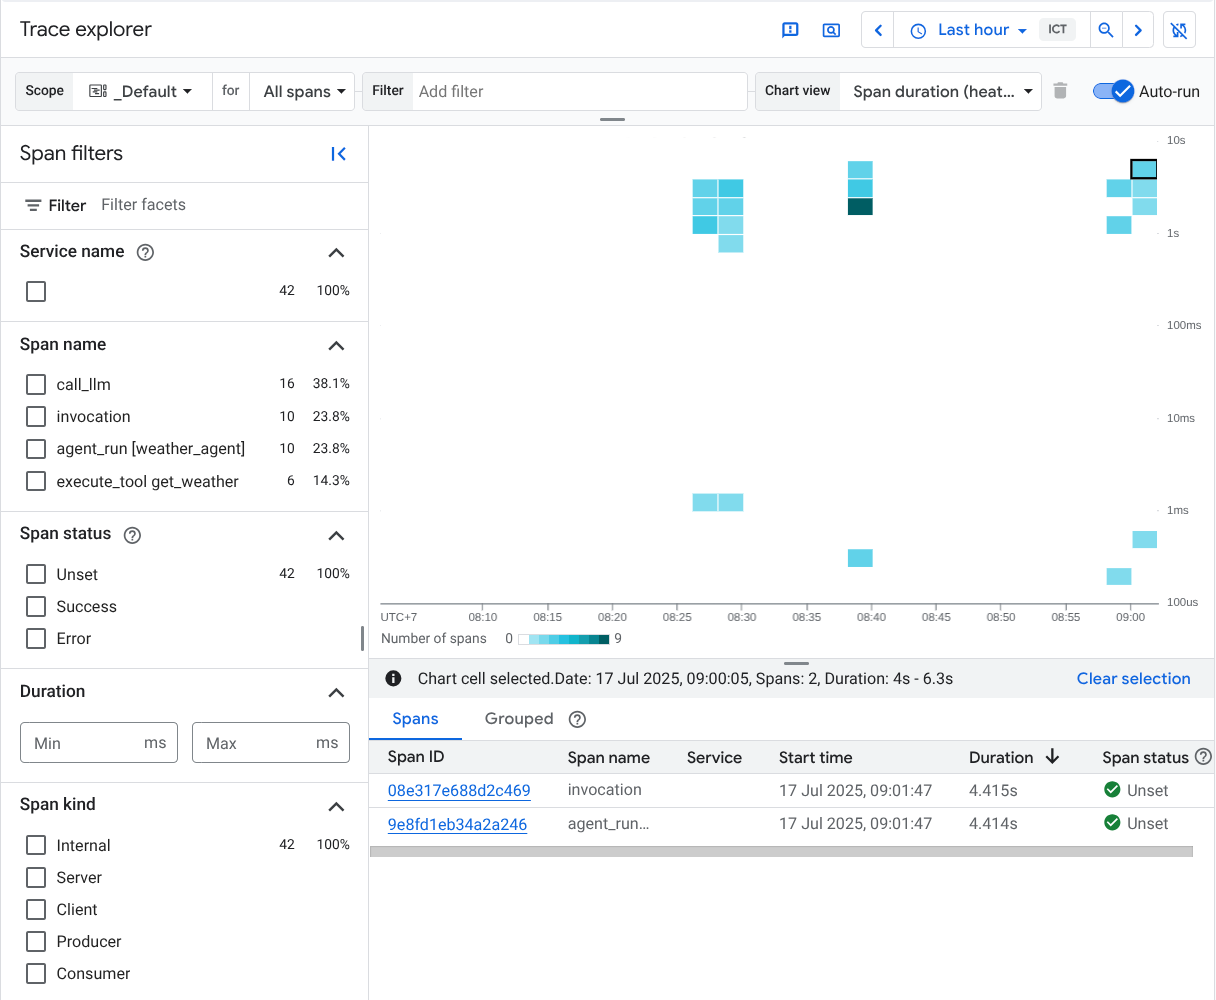
You will see all available traces produced by the ADK agent, with span names such as invoke_agent, generate_content, call_llm, and execute_tool.
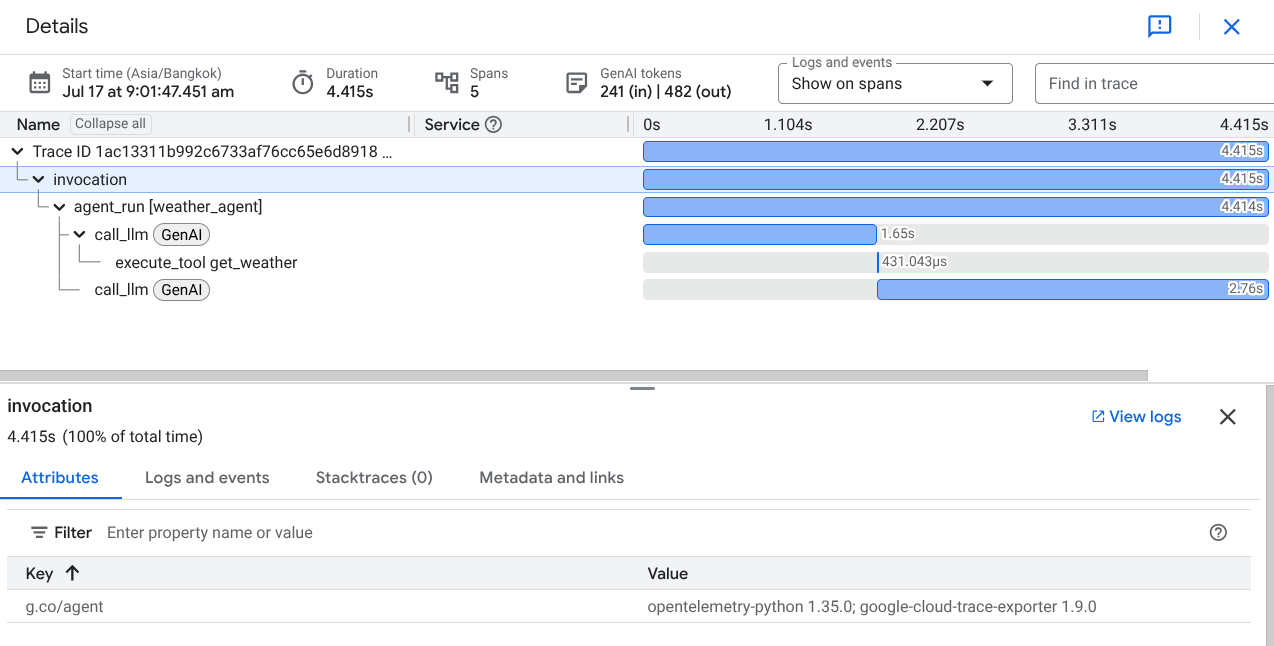
If you click on one of the traces, you will see a waterfall view of the detailed process, similar to the trace view in the local ADK web UI.